ORB Hold-Time Metric
The hold-time metric measures the duration of price action outside a defined boundary to confirm trend strength, and data logged at orb trading expectancy tbcmikah tracks these specific movements during the intraday session. Calculating the time spent beyond the opening range provides a mechanical filter for an opening range breakout. A quick spike that fails to hold above the high of the first fifteen minutes often results in a failed move rather than a sustained trend.
Defining the Hold-Time Metric
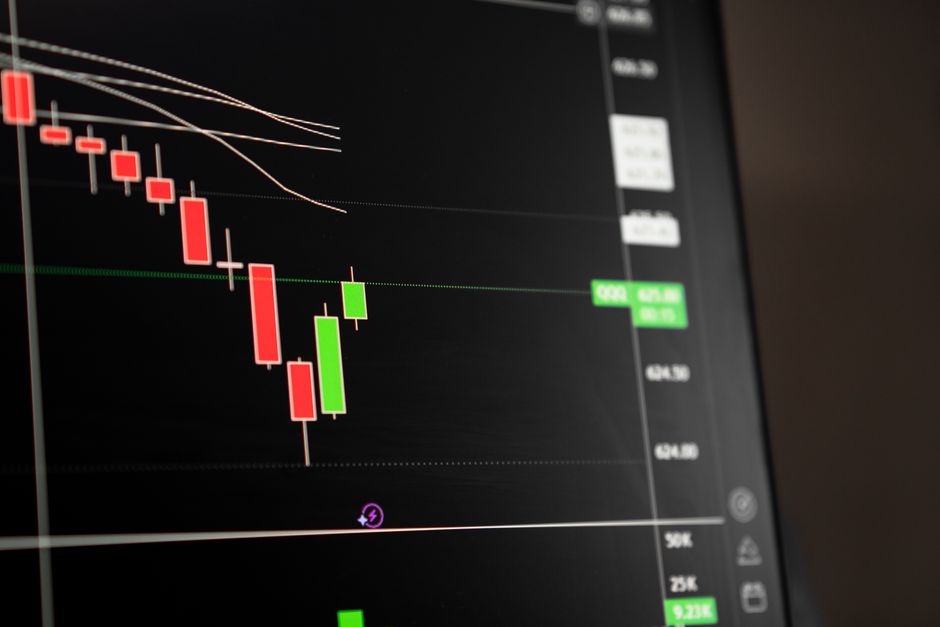
The metric operates by timing the interval between the initial break of a boundary and the moment price returns to the interior. A valid trend requires the price to stay outside the five minute range for a specific number of bars. If the price breaches the high of the opening bell but falls back into the range within two bars, the breakout lacks momentum. A high-quality trend shows price maintaining a position outside the initial boundaries for at least thirty minutes. This measurement removes the guesswork from volatility spikes that lack follow through.
Calculating the Duration
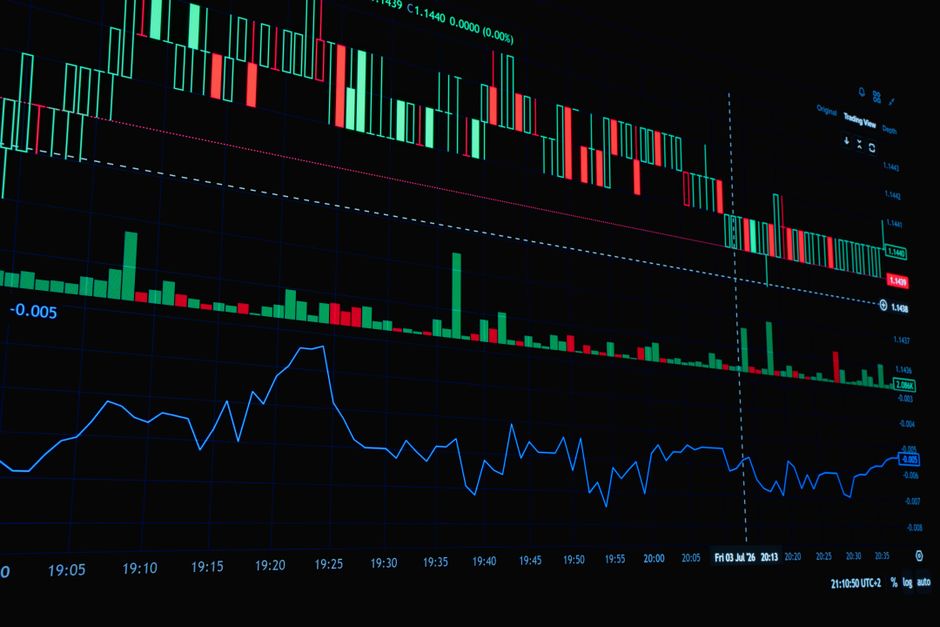
Calculations begin at the moment of the breach. For a fifteen minute range, the timer starts when a candle close occurs outside the established high or low. The timer stops if a candle closes back inside the range or if a new session high is established. Practitioners record the total number of minutes spent in the external zone. A short duration suggests a liquidity grab rather than a directional shift. A long duration indicates that the market has accepted the new price level as the current equilibrium for the session.
Timeframe Selection and Consistency
The chosen timeframe dictates the sensitivity of the metric. Using a 5 minute chart allows for precise measurement of hold times, while a 60 minute chart provides a broader view of institutional commitment. A thirty minute range offers a balance between noise reduction and signal speed. Consistency in using the same timeframe across multiple days ensures that the data remains comparable. Variations in the time frame used for measurement will skew the results of the statistical analysis.
Filtering False Breakouts
False breakouts often occur immediately after the market open. These moves lack the duration required to satisfy the hold-time threshold. By requiring a minimum duration outside the opening range, the mechanical filter excludes many high-volatility, low-conviction moves. The data shows that trends with a hold time exceeding ten minutes have a higher probability of reaching the target than those that revert to the mean quickly. This method focuses on the persistence of price rather than the velocity of the initial move.
Data Aggregation and Validation
Validating a trend requires looking at the hold time across many sessions. A single instance of price staying outside a range does not prove an edge. Large datasets collected during regular trading hours show that certain time periods produce more reliable hold times. Patterns emerge when the duration is measured against the total volume of the session. Mechanical execution relies on these measured constants rather than visual impressions of price movement.