Opening Range Expansion
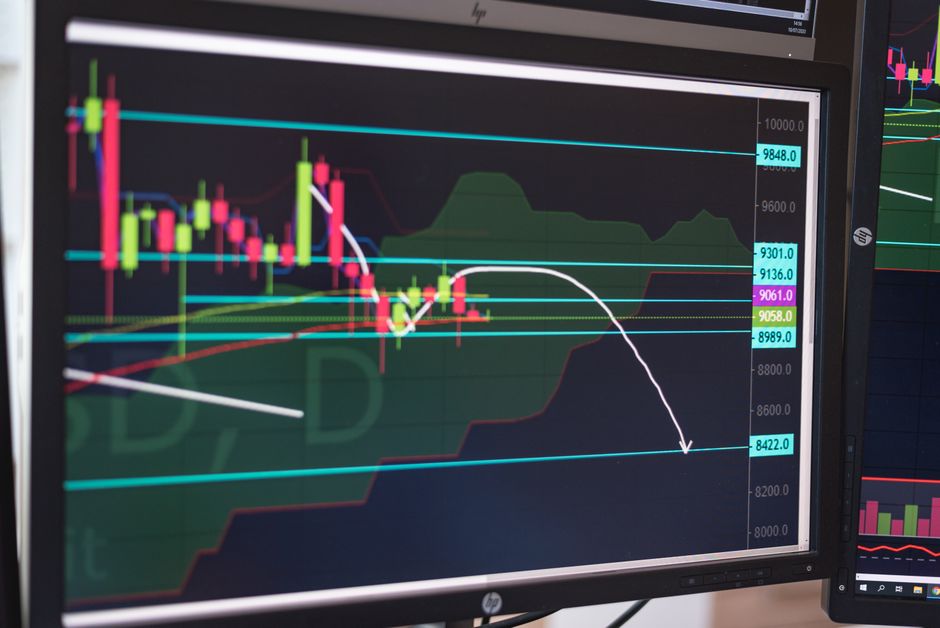
Two trend lines that look identical on a chart can represent vastly different levels of velocity. The mechanics of momentum shifting away from the opening range breakout are analyzed through the specific metrics that orb trading expectancy tbcmikah provides to differentiate between a drift and a true expansion. While a standard orb strategy often focuses on the boundary itself, the speed of the departure determines the quality of the move during regular trading hours.
Velocity and Boundary Departure
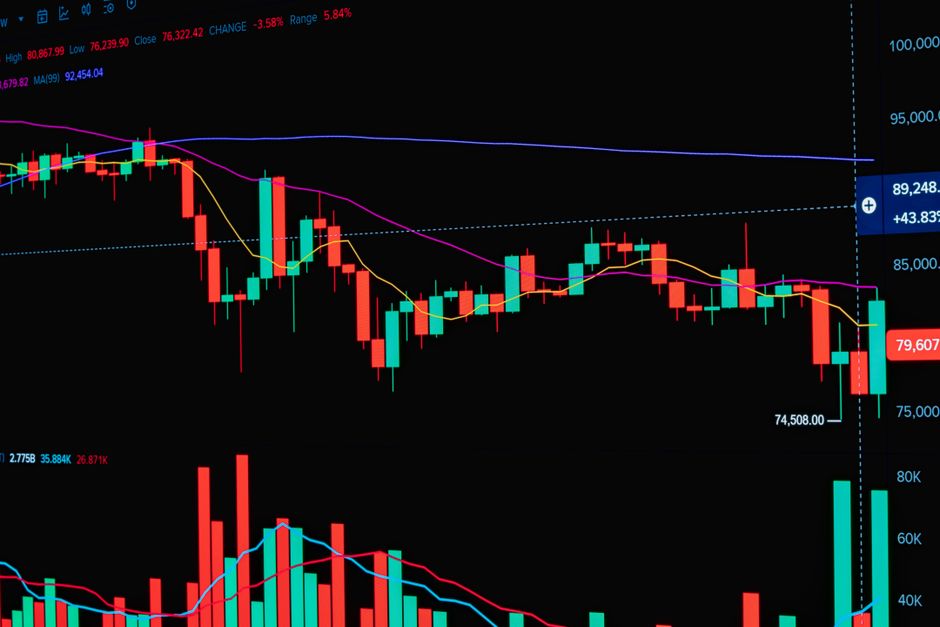
Price does not move away from the session high or low at a constant rate. Expansion requires a measurable acceleration immediately following the establishment of the initial boundaries. A slow creep away from the five minute range often leads to a mean reversion toward the mid point of the opening range. High conviction moves exhibit a steep angle of departure. This angle is measured by the distance traveled relative to the time elapsed since the market open. If the price lingers near the boundary, the expansion is failing. A rapid move suggests that the initial orders are being absorbed and the market is seeking a new equilibrium point.
Timeframe Selection for Momentum
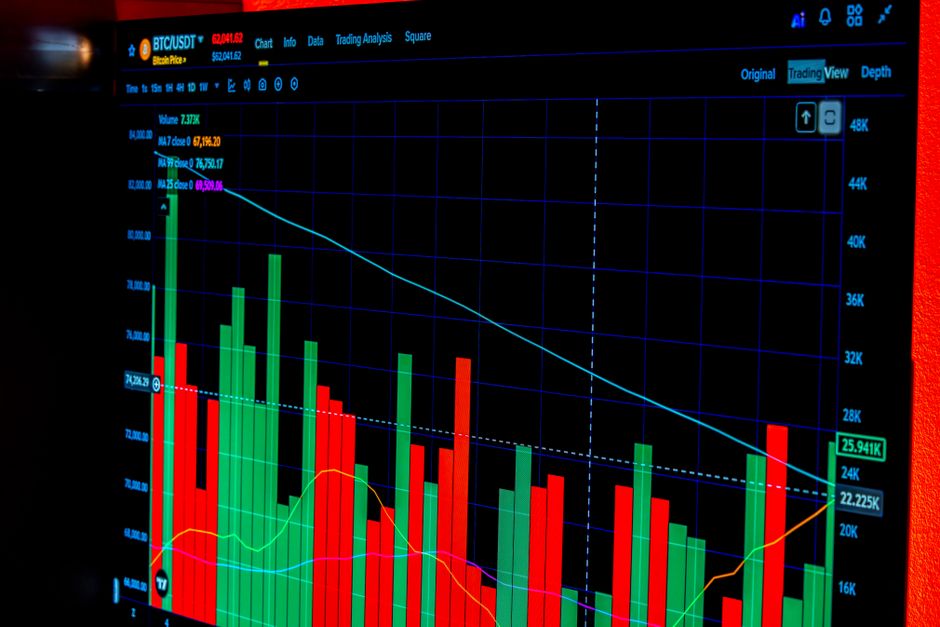
The choice of a specific timeframe dictates the granularity of the expansion measurement. A 5 minute chart captures the immediate burst of volatility, whereas a 15 minute or 30 minute range provides a smoother view of the trend direction. Using a sixty minute range provides a wider context but often misses the initial impulse. The most effective way to track expansion is to compare the distance from the boundary to the volume profile at the cash open. If the volume is concentrated at the edge of the range and the price moves rapidly away, the expansion has high mechanical validity. A lack of volume during a breakout suggests a false expansion that will likely fail before the first hour concludes.
Measuring the Expansion Ratio
Expansion is quantified by the ratio of the breakout distance to the width of the initial range. If the thirty minute range is twenty points wide, an expansion of ten points in the first ten minutes after the range is set indicates high momentum. This ratio allows for a comparison across different instruments. A small sample of price action often fails to show a clear trend if the expansion ratio is below one to one. The velocity of the move must outpace the typical noise seen in the premarket session. High speed expansion typically leaves behind a trail of higher lows or lower highs that prevent a return to the opening range during the early session.
Volatility and Range Width
The width of the opening range sets the stage for the subsequent movement. A narrow range often precedes an explosive expansion, while a wide range can limit the potential for further intraday movement. The relationship between the initial range size and the subsequent expansion is a mathematical constant in many high probability setups. Measuring the speed of the price relative to the volatility of the overnight session provides a baseline for what constitutes a significant move. When the price moves away from the boundary with increasing volume, the expansion is confirmed by the mechanical reality of the order flow.