Intraday Trend Alignment

The sharp ringing of the opening bell signals the start of the mechanical execution process described at orb trading expectancy tbcmikah regarding intraday trend alignment. High probability orb setups require a strict comparison between the immediate price action and the broader market structure. An opening range breakout lacks direction if the higher timeframe does not support the move. The data points collected during the first fifteen minutes must be weighed against the previous day and the overnight session to determine if a trend is actually forming or if price is merely oscillating within a range.
The Role of Higher Timeframe Structure
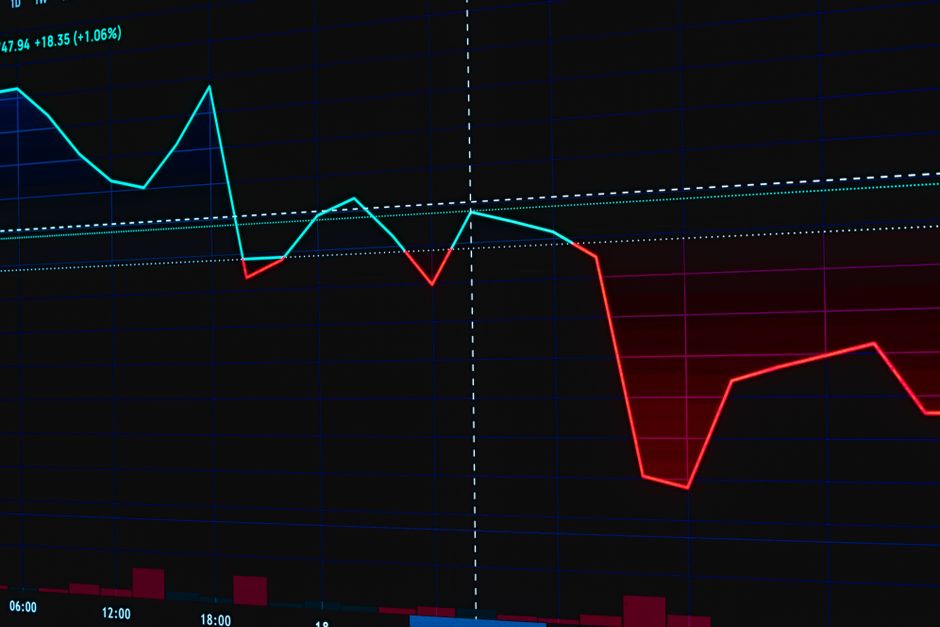
Filtering signals involves looking at the 60 minute chart before the market open. A bullish opening range breakout carries significantly more weight if the price is currently trading above the prior day high and the 60 minute moving average. If the 5 minute chart shows a breakout but the larger timeframe is trapped in a descending channel, the trade is a low probability event. The mechanical filter is simple. Only take long signals that align with the slope of the higher timeframe trend. Only take short signals that align with the downward slope of the higher timeframe trend. This reduces the number of trades but increases the accuracy of the signal.
Measuring the Opening Range
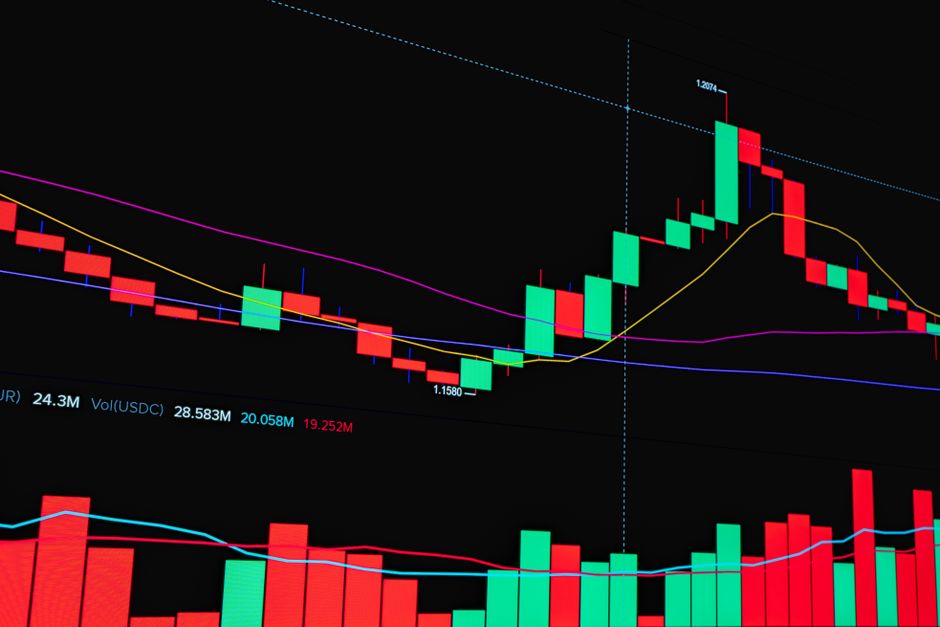
The first thirty minute range provides a solid boundary for intraday direction. A breakout of the thirty minute range is often a more stable signal than a breakout of the five minute range. The five minute range is prone to noise and false breakouts during the initial volatility of the cash open. By waiting for the thirty minute range to establish, the direction of the session high is often revealed. The process requires observing whether the price holds above the opening range or fails back into the middle of the range. A failure back into the range often precedes a reversal toward the opposite side of the opening range.
Timeframe Confluence and Execution
Execution depends on the alignment of the 15 minute and the 60 minute charts. If the 15 minute chart shows a series of higher lows, the intraday trend is established. An orb signal that occurs against this structure is ignored. The work involves plotting the premarket highs and lows and seeing how the price interacts with them at the market open. If the price breaks the premarket high and aligns with a bullish 60 minute structure, the edge is present. If the price breaks the premarket high but the 60 minute structure is bearish, the move is likely a trap.
Managing the Session
The trend continues until a structural shift occurs on the 15 minute chart. Monitoring the session high allows for the identification of the peak of the move. Once the trend breaks, the trade is closed. The goal is to capture the meat of the move between the opening bell and the mid day lull. Relying on the opening range breakout requires discipline to avoid chasing price after the initial expansion has already occurred. The mechanical rules prevent entering a trade after the move has become exhausted.