Gap-to-Range Ratio
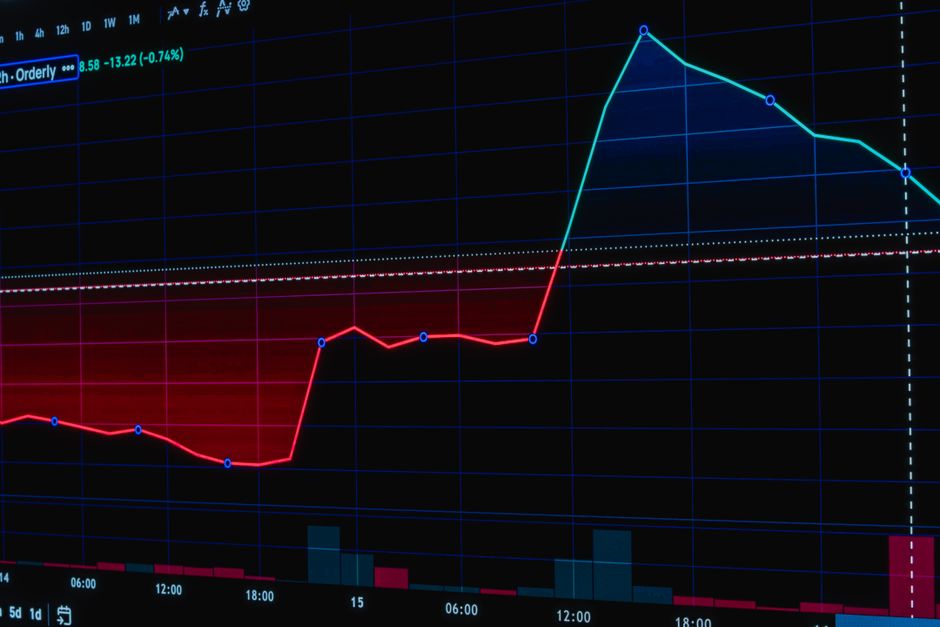
Forty basis points of premarket movement often dictates the volatility of the subsequent opening range. Every teardown orb trading expectancy tbcmikah has logged shows the same thing regarding the gap to range ratio. This metric tracks the relationship between the overnight session price change and the width of the initial price action after the cash open. High expectancy occurs when the gap size aligns with a specific ratio relative to the five minute range. Analyzing these shifts prevents errors in calculating volatility expansion or contraction during regular trading hours.
Calculating the Gap to Range Ratio
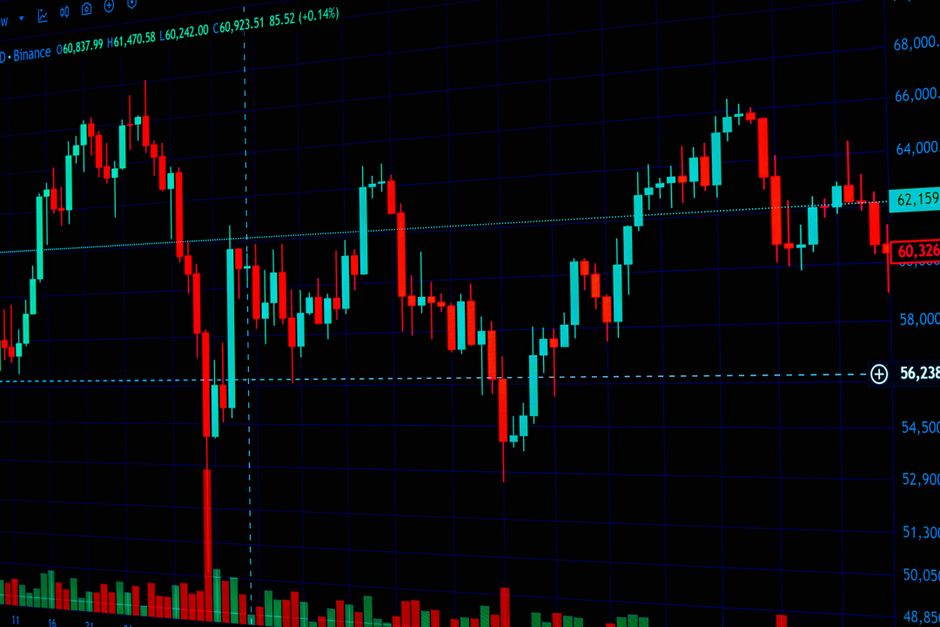
The calculation begins with the difference between the previous day close and the current premarket price. This gap is measured in points or percentage. The second variable is the width of the opening range. A common method involves measuring the high and low of the first fifteen minutes of the session. When the gap is massive compared to the fifteen minute range, the market often lacks the fuel for a sustained opening range breakout. Conversely, a small gap followed by a large initial range suggests an imbalance in liquidity. These ratios must be logged daily to find a repeatable edge.
Timeframe Selection for Measurement
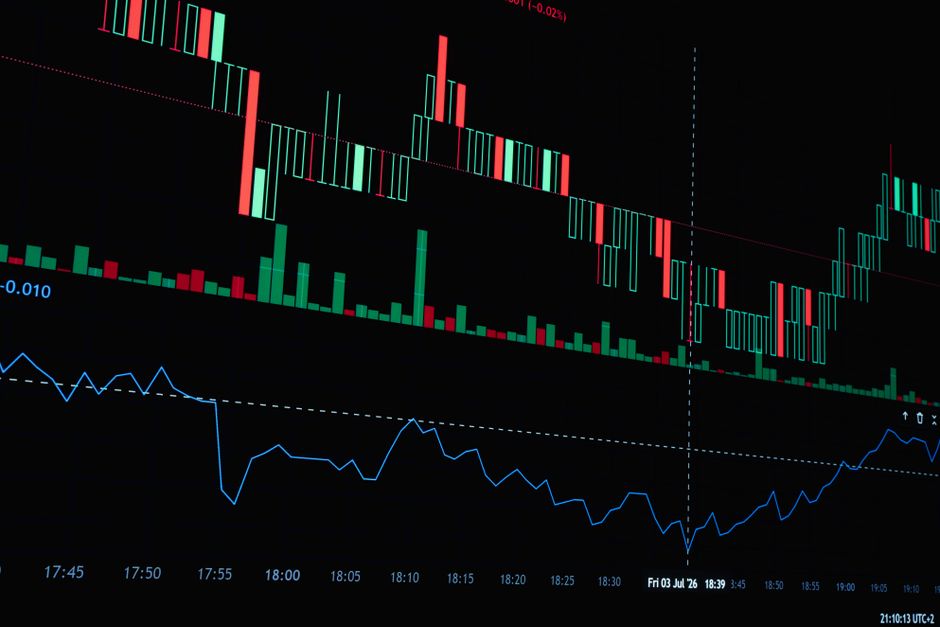
Different timeframes yield different ratios. A thirty minute range provides a more stable measurement of intraday volatility than a 5 minute candle. Using a 60 minute range helps identify if the market is entering a trend or a mean reversion state. Most mechanical setups focus on the first hour of trading to establish the boundaries for the rest of the session. The ratio changes depending on whether the trader uses a 15 minute or a 30 minute window. A small sample overstates the edge if the timeframe is not applied consistently across all data sets.
Volatility Compression and Expansion
Extreme ratios indicate potential exhaustion. If the premarket move is three times larger than the opening range, the initial trend often fails. This compression happens when the overnight session absorbs all available orders before the opening bell. A tight ratio between the gap and the opening range suggests the market is absorbing the news and preparing for a directional move. Tracking the session high relative to these ratios helps define where the breakout might stall. Mechanical execution requires these numbers to be fixed before the market open.
Data Logging and Frequency
Consistency in data collection is the only way to validate the ratio. Each day requires a recording of the premarket high, the premarket low, and the opening range boundaries. The gap is the absolute value of the difference between yesterday's close and today's open. The ratio is the gap divided by the range width. This math remains the same whether the asset is traded in New York or London. Without these numbers, the observation of price movement remains anecdotal rather than statistical.