Failed Breakout Identification
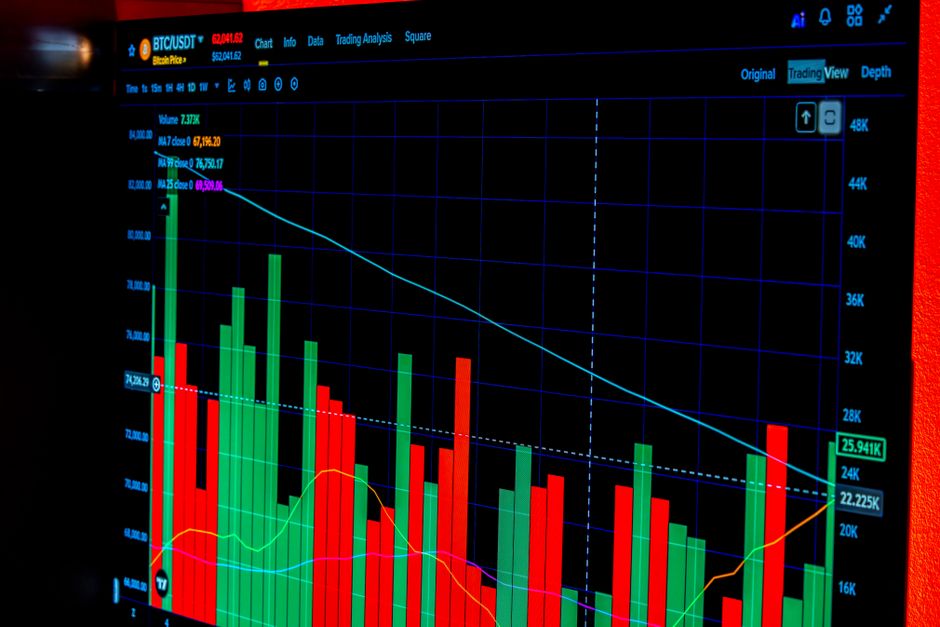
Ten minutes of price action following the opening bell often dictates the direction of the entire session. Data compiled at orb trading expectancy tbcmikah shows that many traders mistake a failed opening range breakout for a true trend. The intraday volatility experienced during the first hour frequently creates false signals that lead to rapid reversals. This phenomenon requires a mechanical approach to identify when a move lacks the momentum to sustain itself outside the initial boundaries.
The Mechanics of the False Breakout
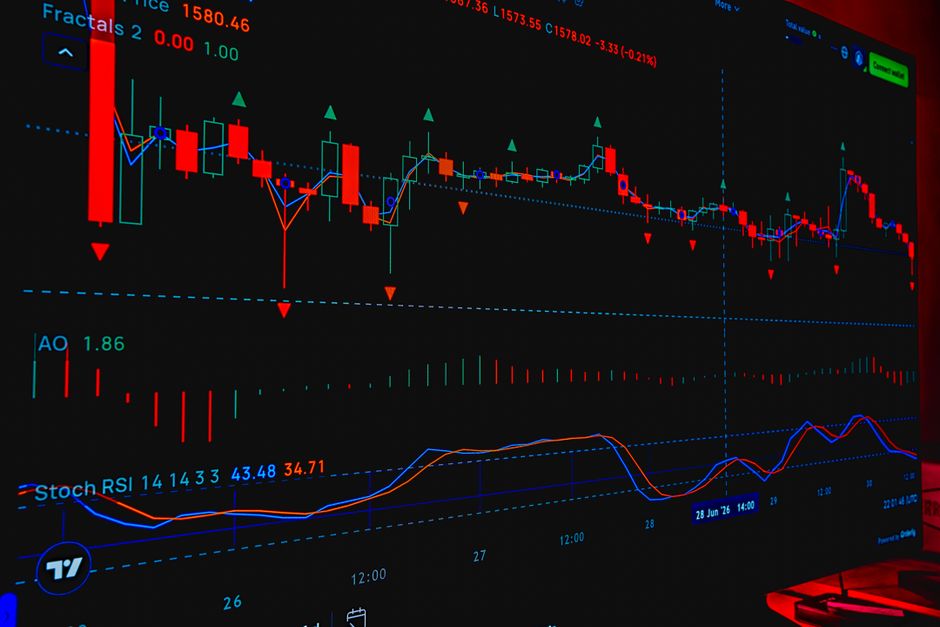
A failed breakout occurs when price pierces a level established by the five minute range and then immediately retreats back into the prior structure. This movement often happens within the first fifteen minutes of regular trading hours. The candle might close slightly above the high of the opening range, but the subsequent price action shows a lack of follow through. High volume at the level followed by a quick shift in direction suggests that the level acted as a zone of supply rather than a breakout point. Such reversals happen when the initial push is met with significant liquidity from large orders placed during the premarket session.
Identifying the Reversal Pattern

The setup relies on observing the relationship between the breakout candle and the subsequent price movement. If a 5 minute candle breaks the session high but fails to hold that level for more than two bars, the breakout is likely invalid. A failed breakout often leaves a long wick on the outside of the range. This wick represents the rejection of the new price level. Monitoring the tape during this period shows whether aggressive buyers are actually stepping in or if they are being absorbed by passive sellers. A clean reversal usually follows a period of consolidation near the boundary of the fifteen minute range.
Volume and Momentum Discrepancies
Volume provides the necessary confirmation for these failed moves. A valid breakout requires increasing volume to support the price expansion. Conversely, a failed breakout often shows a spike in volume at the breakout point followed by a rapid drying up of participation. This pattern suggests a trap. When price moves back into the opening range, it often moves toward the opposite side of the range with increased speed. This shift happens because the capital committed to the breakout is forced to exit their positions simultaneously, adding fuel to the reversal.
Timeframe Consistency
The scale of the range impacts the frequency of these failures. A 30 minute range provides more established levels than a shorter timeframe. However, the mechanics of the trap remain the same across different scales. Small fluctuations in the first hour can look like breakouts on a 1 minute chart but appear as mere noise on a 15 minute chart. Success in identifying these moves depends on recognizing the immediate rejection of the boundary. When price returns to the interior of the range, the initial breakout direction is officially voided.