The False Breakout Trap
Many traders enter a position as soon as the price clears the high of the first fifteen minutes and immediately get stopped out. The observations at orb trading expectancy tbcmikah suggest that these premature entries fail because they ignore the liquidity grab that often occurs immediately after the market open. A successful opening range breakout strategy requires watching the price action just outside the established boundaries to see if the move has actual momentum or if it is merely a hunt for liquidity.
The Mechanics of the Stop Hunt
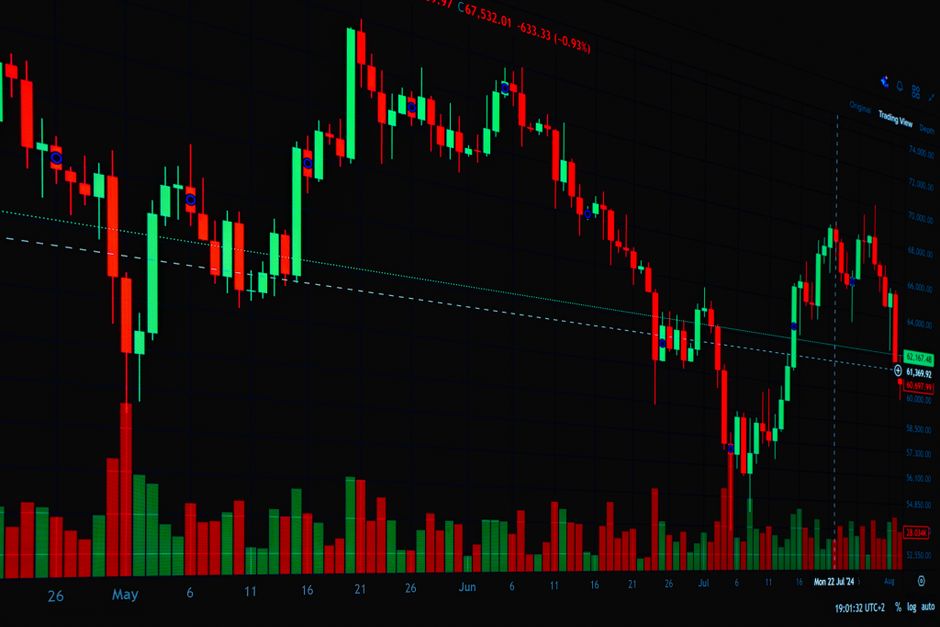
Liquidity resides just beyond the session high and the session low. Large orders often sit behind these levels, waiting to be triggered. When the price pushes slightly beyond the five minute range, it triggers the stops of those who are shorting the reversal. This surge of buying pressure provides the necessary liquidity for larger players to fill sell orders. A candle that pokes above the opening range and then closes back inside the range indicates a failed breakout. This specific pattern often precedes a move in the opposite direction.
Identifying the False Breakout

A real move maintains volume and holds above the level. A trap shows a quick spike followed by a rapid rejection. Watching the 5 minute candle close is the mechanical way to filter these events. If the candle wicks heavily above the boundary but the body remains within the range, the edge has shifted. The price is likely to seek the opposite side of the range rather than continuing the trend. This behavior happens frequently during regular trading hours when volatility is highest.
Timeframe Selection and Execution
The choice of a 15 minute range versus a 30 minute range changes the probability of these traps. A smaller timeframe provides more frequent signals but also more noise. A larger timeframe offers more stability but requires more patience. The work involves looking for the confluence of a failed breakout and a reversal candle. Once the price re-enters the range, the direction of the next leg is often toward the other side of the established boundary.
Volume and Rejection Patterns
Volume often spikes during the false breakout. This spike represents the stop-loss orders being hit. If volume remains low during the breakout attempt, it lacks the conviction to sustain a trend. A high volume wick at the top of the first hour is a mechanical signal of a potential reversal. The goal is to wait for the trap to complete before looking for a direction. Entering before the rejection is confirmed is a primary cause of drawdown in intraday setups.