Gap Fill Probability
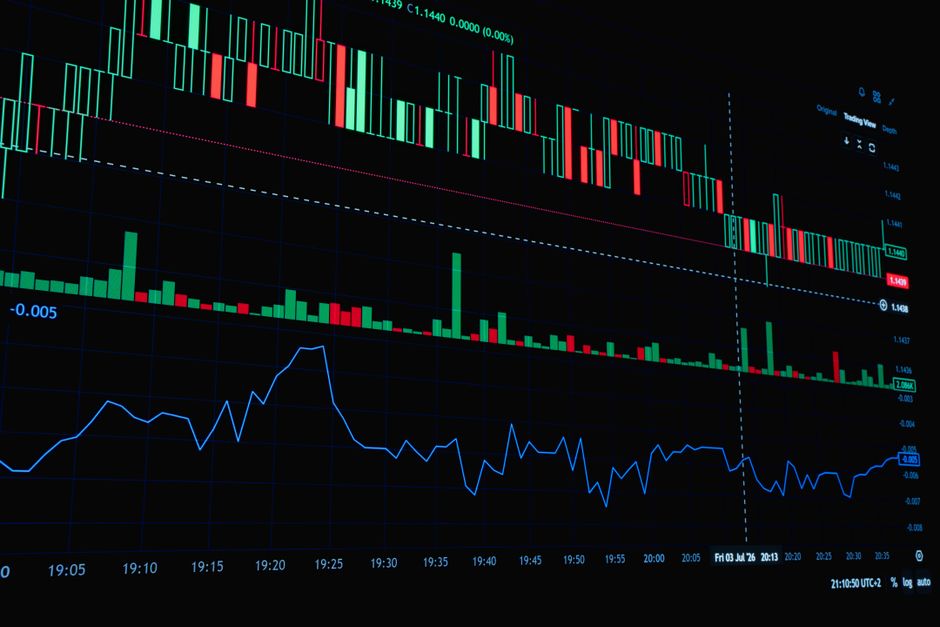
Two different price gaps that look identical on a single candle chart can behave very differently during the first hour of trading, as the data at orb trading expectancy tbcmikah shows. A gap fill probability depends on the mechanical relationship between the premarket levels and the opening range breakout. The volatility seen at the cash open often dictates whether a gap remains open or closes before the midday lull.
Defining the Gap Fill Mechanism
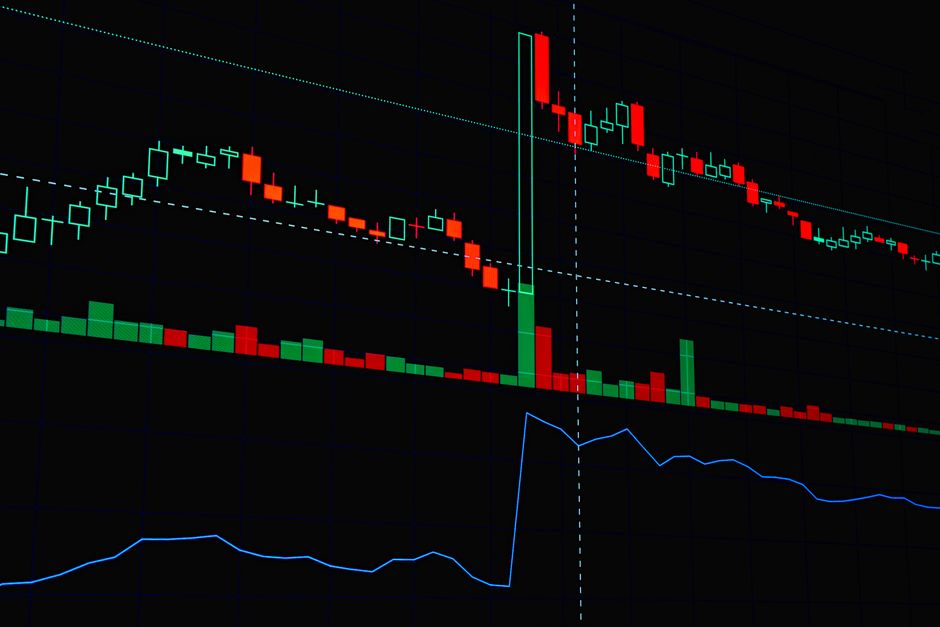
A gap occurs when the opening bell price sits away from the previous day's close. The probability of a return to that close increases when the initial movement lacks momentum. If the five minute range establishes a tight boundary without immediate expansion, the likelihood of a reversion grows. This is not a matter of intuition. It is a matter of observing how much volume supports the move away from the previous close. If the volume at the market open is low, the gap often acts as a magnet rather than a launchpad.
Timeframe Selection and Data Accuracy

The specific timeframe used to measure the initial move changes the math. Using a thirty minute range provides a broader view of the initial sentiment than a 5 minute chart. A 15 minute setup might show a breakout, but a larger timeframe often reveals that the move is just a liquidity grab. Observations show that the first fifteen minutes provide the highest density of data for calculating these probabilities. A small sample overstates the edge if the data only covers a single week of regular trading hours.
Measuring the Opening Range
The opening range defines the boundaries for the session. When a price breaks out of the sixty minute range, the gap fill becomes a secondary concern to trend continuation. However, if the move stays within the confines of the first hour, the probability of a gap fill rises. A breakout that fails to hold above the high of the opening range often leads to a rapid descent toward the previous day's close. This mechanical failure is a measurable event. It relies on the failure of buyers to sustain the price above the initial levels established during the premarket session.
Volume and Gap Persistence
Volume profiles indicate the strength of a gap. High volume during an opening range breakout suggests a trend that will likely leave the gap open. Conversely, low volume suggest a lack of conviction. If the price struggles to move away from the previous day's close during the first hour, the gap fill is the probable outcome. This pattern repeats across various instruments. The math remains constant. The session high is often established after the initial gap attempt fails to gain traction.